
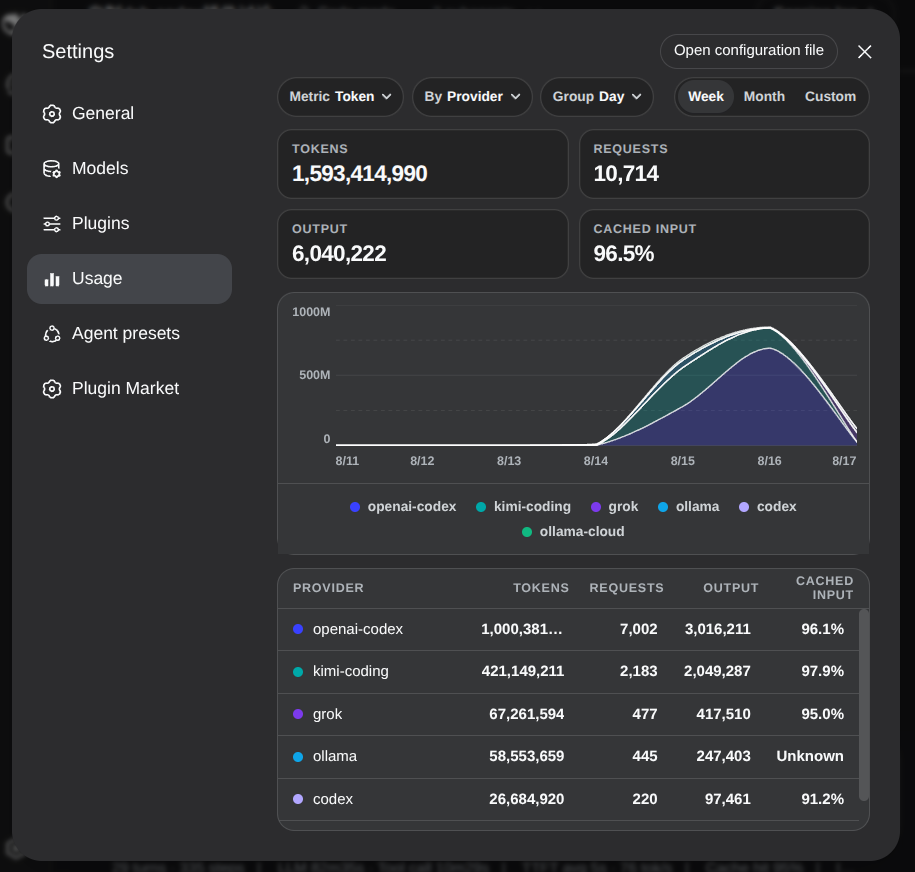
Settings usage dashboard: tokens, requests, output tokens, and cache-hit rate from session logs, with a stacked chart and a breakdown table by provider, model, or workspace.
- GitHub stars
- 2
- License
- MIT
- Added
- 2026-08-18
GitHub info
- GitHub stars
- 2
- License
- MIT
- Primary language
- TypeScript
- Last push
- Aug 19, 2026, 11:31 AM
- Maintainer
- NOirBRight
- Added
- 2026-08-18
Preview from README
Screenshots and GIFs extracted from the repository README (badges and avatars filtered out).
Install
dsh plugin --profile web add github:NOirBRight/dsh-usage-monitorREADME badge
Add this Markdown to your plugin README to link back to its listing.
[](https://dshget.com/plugins/NOirBRight/dsh-usage-monitor)Related plugins
Usage & Billingdsh-context
★ 1176DSH context insight panel: Context dashboard + /context command + Context browser — one-stop context lifecycle management with categorized composition, content details, evolution trends, compaction/injection events, and stats.
dsh-cost-meter
★ 224Per-session and daily API cost, budget with usage %, official balance, history dashboard, and one-click official price sync with peak/off-peak pricing.
TokenLedger
★ 189Sidebar usage panel that attributes tokens to the relay site that served each request, read from your existing provider config: today/month/all-time totals, per-site and per-model breakdowns, a year activity heatmap, and New API / Sub2API / DeepSeek balances.